Homeowners selling their home in the second quarter of 2017 saw their largest profit gain in the past decade, according to the Q2 2017 U.S. Home Sales Report from ATTOM Data Solutions, a multi-sourced property database.
Homeowners who sold their home during the second quarter gained an average $51,000, the highest average price gain for home sellers since the second quarter of 2007’s $57,000.
This increase represents an increase of 26% from the previous home purchase price, the highest average return since the third quarter of 2007’s 27%.
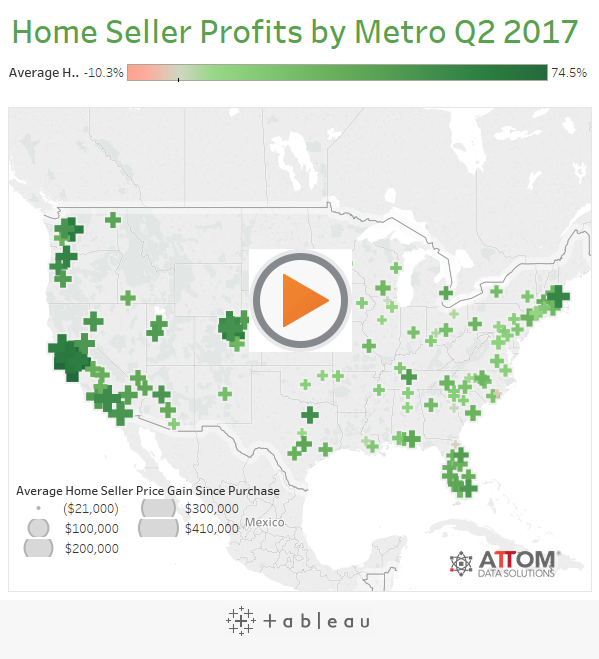
The interactive map below shows which areas of the U.S. produced the highest average gains in the second quarter.
The reason for this increase could be credited to the rising home prices, but the length of time homeowners live in their homes is also a significant factor.
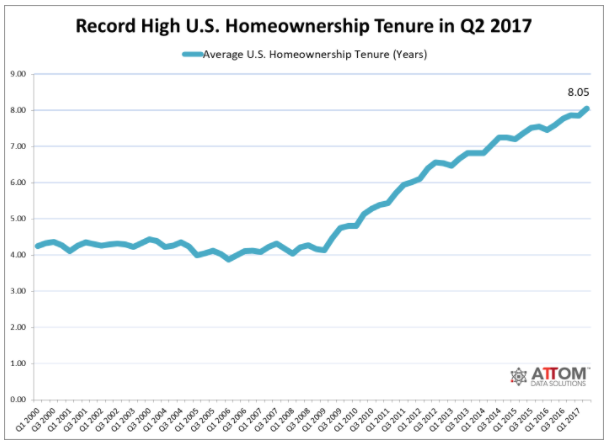
Homeowners who sold their home in the second quarter had owned their home for an average of 8.05 years. This is up from 7.85 years in the previous quarter and 7.59 years in the second quarter last year. In fact, it marks the longest homeownership tenure since ATTOM began tracking in the first quarter of 2000.
Click to Enlarge
(Source: ATTOM)
“Potential home sellers in today’s market are caught in a Catch-22,” ATTOM Senior Vice President Daren Blomquist said. “While it’s the most profitable time to sell in a decade, it’s also extremely difficult to find another home to purchase, which is helping to keep homeowners in their homes longer before selling.”
“And the market is becoming even more competitive, with the share of cash buyers in the second quarter increasing annually for the first time in four years,” Blomquist said.
The share of all-cash sales decreased from last quarter’s 31.3% to 28.9% in the second quarter. However, this is up from last year’s 27.3%, and marks the first annual increase since the first quarter of 2013.


