New data from the Federal Reserve shows home equity reached an all-new high in mid-2107, surpassing the previous 2006 peak.
Home equity wealth reached $13.9 trillion halfway through the year, up $0.5 trillion from the 2006 peak and up $6 trillion from the the lowest point in the Great Recession.
Much of the recovery of this wealth is due to rapidly rising home prices, the November 2017 U.S. Economic Outlook report from CoreLogic explained. The company’s Home Price Index increased 48% from March 2011 to June this year.
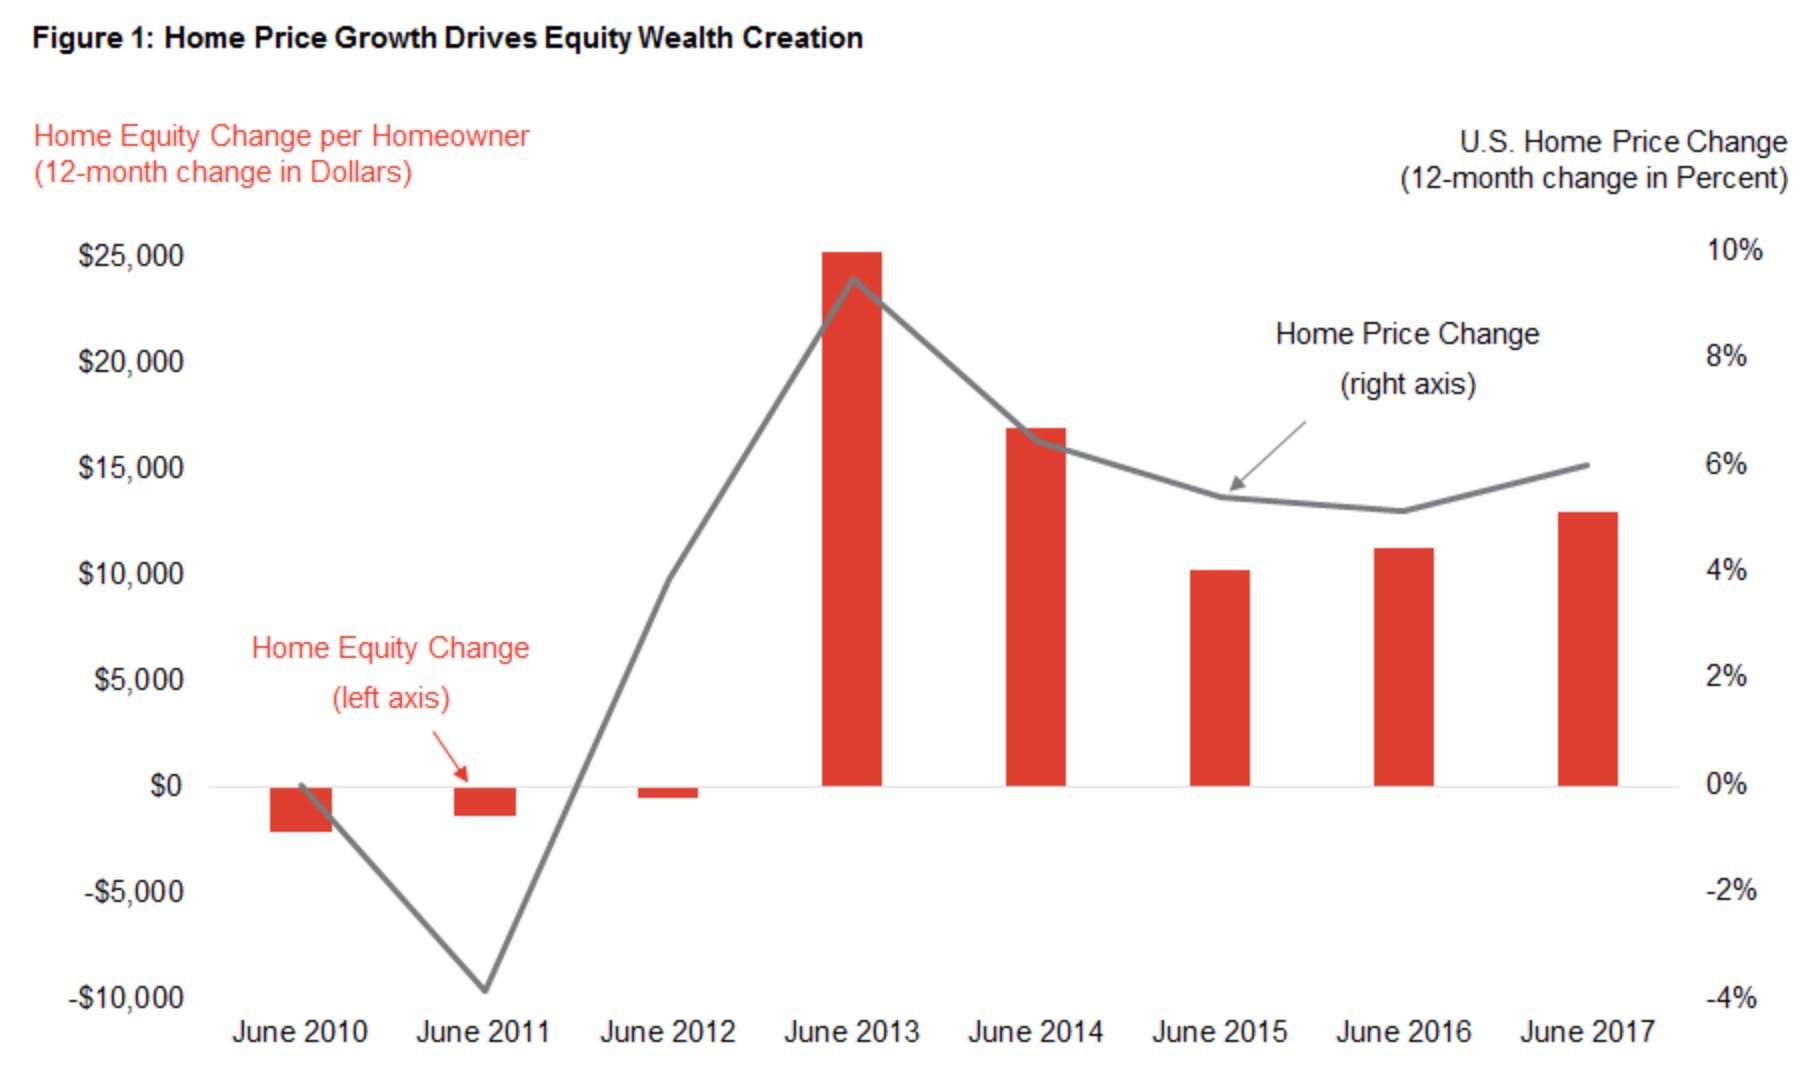
The chart below shows the correlation between home price changes and the amount of home equity per homeowner.
Click to Enlarge
(Source: CoreLogic)
The chart shows that when home prices are stagnant or falling, equity typically declines, whereas price growth generally correlates with higher levels of equity.
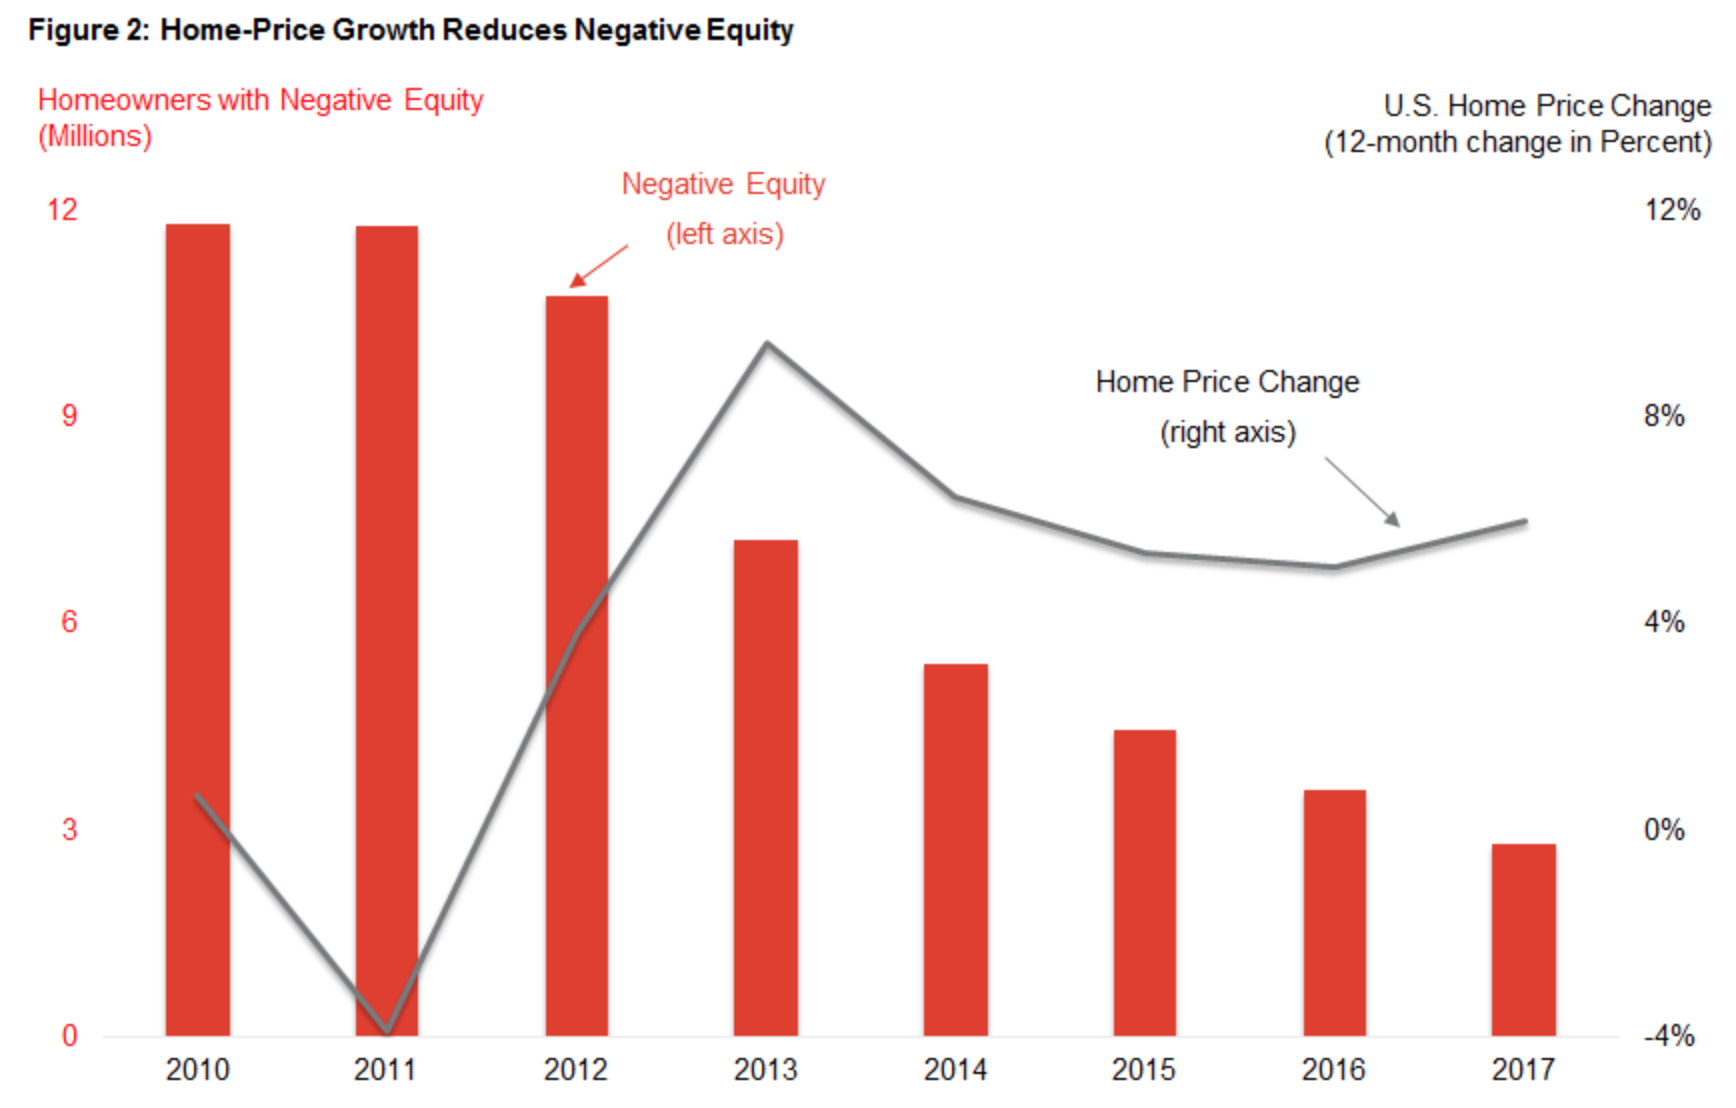
With the increase in home prices, many homeowners have also come out of negative equity. At the end of 2009, 12.2 million homeowners remained in negative equity on their homes, that is, they owed more on their home than what it was worth. This represented a full 26% of homeowners with a mortgage.
However, home-price appreciation has caused the number of homeowners in negative equity to drop from more than 12 million to just under 3 million in 2017, the chart below shows.
Click to Enlarge
(Source: CoreLogic)
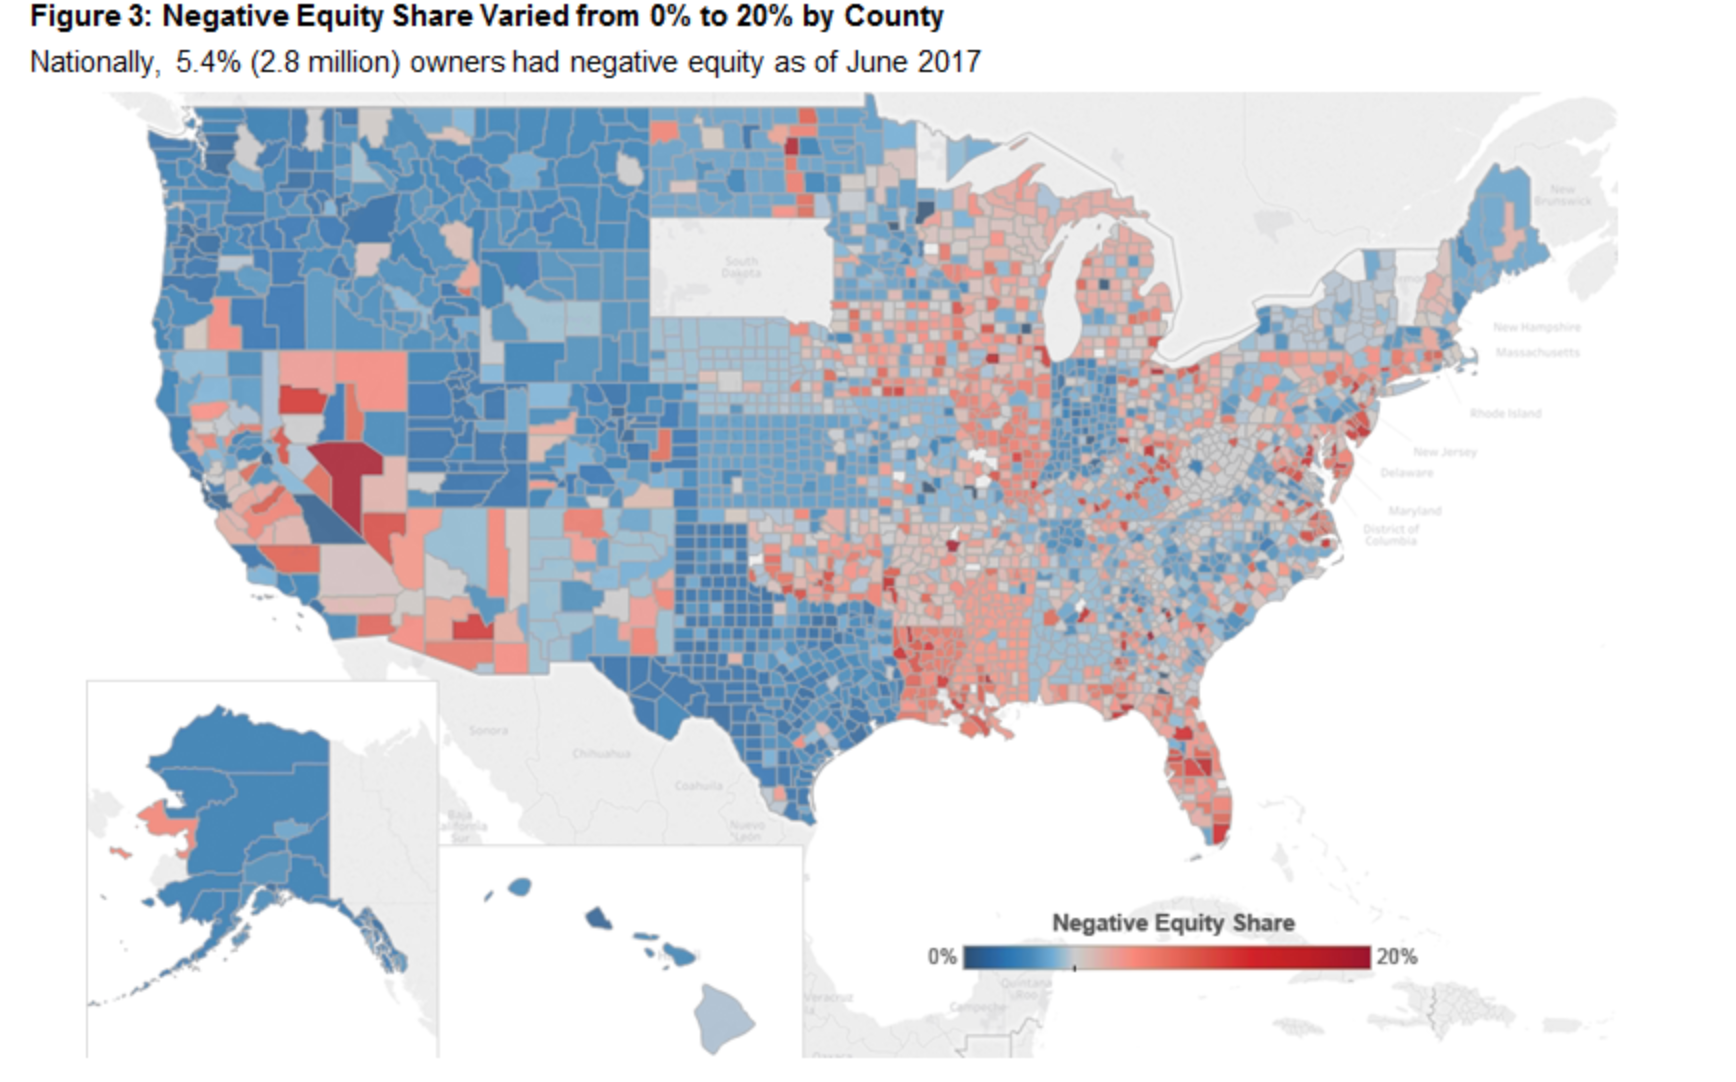
Only about 5.4% of homeowners with a mortgage remained in negative equity by mid 2017, however that number varied significantly across the U.S. The map below shows while some areas held close to 20% of homeowners in negative equity, others were near 0%.
Click to Enlarge
(Source: CoreLogic)
CoreLogic forecasted home prices will rise another 5% in 2018, adding another $1 trillion in home equity wealth across the nation and setting another all-time high.

![[Charts] Home equity wealth hits new high in November](https://www.sierrarealestate.net/wp-content/uploads/2017/11/www.housingwire.comScreen-Shot-2017-11-20-at-81de9ab15e3d74d74882f3ec35dff64590aceefb.png)


